Contents
Overview
Although Uptime Infrastructure Monitor has powerful reporting features, you may want to generate reports in a custom format with a specific set of user-defined data. Microsoft Reporting Services allows you to take data from an MS SQL Server DataStore and use that data to create a report that addresses your specific needs.
Before You Begin
This article assumes that you have installed Microsoft Reporting Services and its prerequisites:
- Internet Information Server (IIS) with ASP.NET
- SQL Server
- Visual Studio .NET
Please also refer to Running Uptime with an MS SQL Server Database.
Setting up a Database Connection
To set up a database connection:
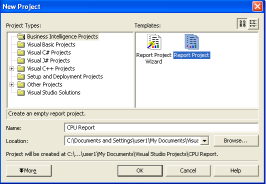
- Start Microsoft Visual Studio .NET and choose File>New>Project.
The following window appears:
- Select the Business Intelligence Projects folder in the left portion of the window.
- Select Report Project template in the right portion of the window.
- Enter a name for your report in the Name field and click OK.
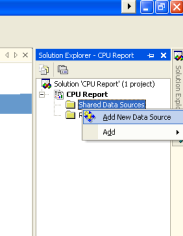
- Click the View / Solutions Explorer button to open the Solution Explorer window.
- Right click Shared Data Sources and then select Add New Data Source.
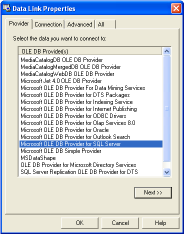
- In the Data Link Properties window, click the Provider tab.
- Double click Microsoft OLE DB Provider for SQL Server, which opens the Data Link Properties window on the Connection tab.
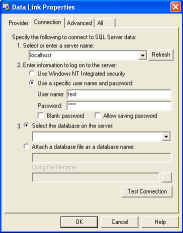
- Enter the name of the database server and the user name / password combination needed to login to the server.
- Click the Test Connection button to verify that you can establish a connection to the database.
- Choose the database from which the data will be retrieved and then click OK.
Configuring a Report using Microsoft Reporting Services
To configure a report in Microsoft Reporting Services:
- In Microsoft Visual Studio .NET, right-click Reports and choose Add New Report.
The Report Wizard starts.
- Click Next.
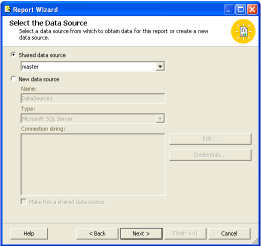
- Select Shared data source and then select the database from which you are retrieving data.
- Click Next.
Enter the following query string:
SELECT e.display_name AS 'Description',
AVG(p.cpu_usr + p.cpu_sys + p.cpu_wio) AS 'CPU Workload Average',(CONVERT(char(10),s.sample_time,102)) AS 'Date'
FROM performance_sample s, performance_aggregate p, entity e
WHERE s.id = p.sample_id
AND e.entity_id = s.uptimehost_id
AND s.sample_time > '2013.11.29'
AND s.sample_time < DATEADD(day,5,'2013.11.29')
GROUP BY (convert(char(10),s.sample_time,102)), e.display_name
ORDER BY (convert(char(10),s.sample_time,102)), e.display_name;
This example will report on the CPU workload average for all systems over the five day period from 2006-11-29 to 2006-12-03 (simply change the dates or the interval as required).
- Click Next after you change the range to suit your needs.
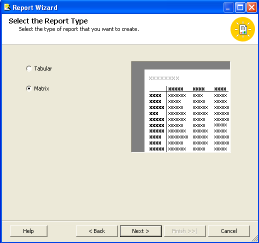
- Choose the Matrix option and then click Next.
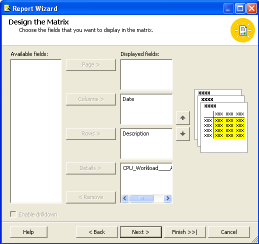
The Design the Matrix window appears, which enables you to change the way in which data is arranged in the report.
In this example:
- Description is moved to the Rows field.
- Date is moved to the Columns field.
- CPU Workload Average is moved to the Details field.
- Click Next.
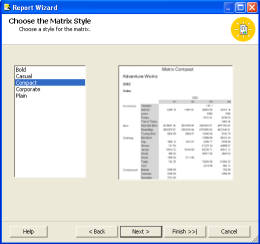
- In the Choose Matrix Style window, select Compact.
The Design the Matrix window appears.
- Select to display all of the fields in the report and then click Next.
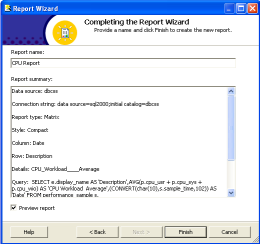
- Click the Preview Report check box at the bottom of the page.
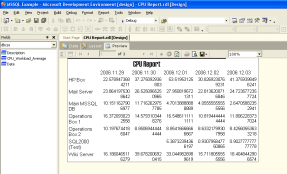
- Click Finish to generate a preview of the report.
Publishing a Report to IIS
When you are satisfied with your report, you can publish it to IIS (Internet Information Server, a Web server that runs under Windows) by completing the following steps:
- In Microsoft Visual Studio .NET, access the Solutions Explorer to open Solution Explorer.
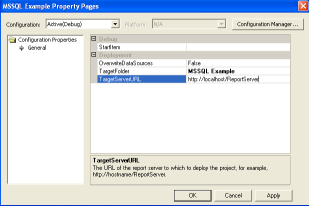
- Right click the current project and select Properties.
- In the Properties window, change the value of
TargetServerURLto the URL where Reporting Services has been installed. For example,http://localhost/ReportServer. - Click OK.
- In the Solutions Explorer, click Debug / Start to publish the report.
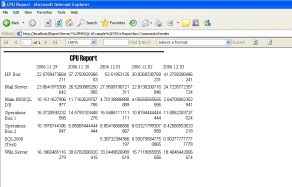
After the report has been published, your default Web browser will automatically open in the directory in which the report was published. Click on the file name of the report to open it.
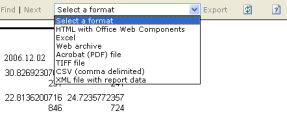
- You can also export the report from your web browser by selecting a format from the dropdown list, as shown below:
Note
http://localhost/Reports/Pages/Folder.aspx.
